Current-Voltage Characterization of Two-Terminal Devices
Linear and Shockley-diode model fits with residual and chi-squared diagnostics
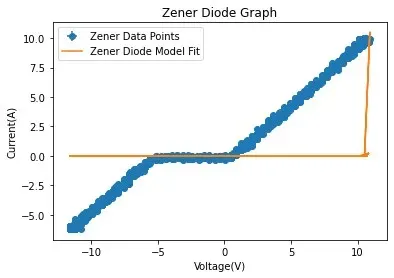
A linear model fit the ohmic devices like the 1000-ohm resistor almost exactly, while the Shockley diode equation broke down on the silicon and Zener diodes, with reduced chi-squared values in the millions flagging those fits as poor.
Objective
This lab set out to characterize how eleven two-terminal electronic devices respond to voltage, and to test how well simple models actually describe them. The lineup ran from ohmic parts (a short circuit, a 47-ohm resistor, a 1000-ohm resistor, a 1.5-volt cell, and a thermistor) to nonlinear ones (germanium, silicon, and Zener diodes, a selenium rectifier, and a vacuum-tube diode). The goal wasn’t just to draw the curves. It was to decide, with numbers, whether each fit was trustworthy.
Approach
Each device sat in a transformer-driven circuit between two resistors, with one resistor and the device wired to separate oscilloscope channels. Running a Keysight DSOX 1202G in X-Y mode traced current against voltage directly, and the swept data went out to a USB stick for analysis. An ohmmeter recorded each device’s resistance as an independent cross-check against Ohm’s law.
In Python, ohmic devices got a linear fit (c = av + b) and the diodes got the Shockley diode equation, with the thermal voltage fixed at 0.025852 V. Uncertainties came from the standard deviation of the measurements. Every fit was then judged two ways: a residual plot to look for structure, and a reduced chi-squared value to put a number on goodness of fit.
Findings
The linear devices fit cleanly. The 1000-ohm resistor’s data fell almost exactly on its model line, and its reduced chi-squared landed near 1.9 x 10^-13. Values that small actually point to overestimated uncertainties, not perfect agreement.
The diodes were the interesting failure. The silicon and Zener I-V curves showed their expected shapes, a sharp forward turn-on and, for the Zener, reverse breakdown below about -5 V. But the Shockley fits missed the data badly. Reduced chi-squared came in around 2.34 million for the silicon diode and 353,700 for the Zener, and the silicon diode’s residuals climbed in a clear trend instead of scattering around zero. The fitted reverse-saturation currents collapsed to absurd magnitudes (on the order of 10^-150), which traced back to the model’s sensitivity to the voltage data and the assumed constants.
Why it matters
A good-looking curve isn’t a good fit. Pairing residual plots with reduced chi-squared caught models that the eye would have passed, and it pinned down exactly where the Shockley equation broke and why.