Assessing Aquatic Health in the Frenchman's Bay Watershed
Benthic macroinvertebrates and road-salt runoff in an urbanized Lake Ontario lagoon
Benthic macroinvertebrate sampling returned a Hilsenhoff Biotic Index of 5.73, placing the Frenchman’s Bay watershed in the "fair" water-quality band despite sitting in one of Canada’s most densely urbanized watersheds.
Objective
The question was simple: how healthy is the water in Frenchman’s Bay, a 27 km² watershed in Pickering that drains some of Canada’s oldest and most densely urbanized land before it reaches western Lake Ontario? Rather than rely on a single chemical reading, the assessment used the animals living in the sediment as the primary signal, then checked road-salt runoff as a second line of evidence.
Approach
Benthic macroinvertebrates were collected and sorted following the Ontario Stream Assessment Protocol (OSAP), then identified to order under a stereo microscope (specimen #10, for example, keyed out to Megaloptera). Counts from the whole class were pooled into a single community dataset. From there I calculated taxa richness, the Shannon-Wiener diversity index, Jaccard similarity, and Bray-Curtis dissimilarity to compare groups, and the Hilsenhoff Biotic Index to translate pollution tolerance into a water-quality score.
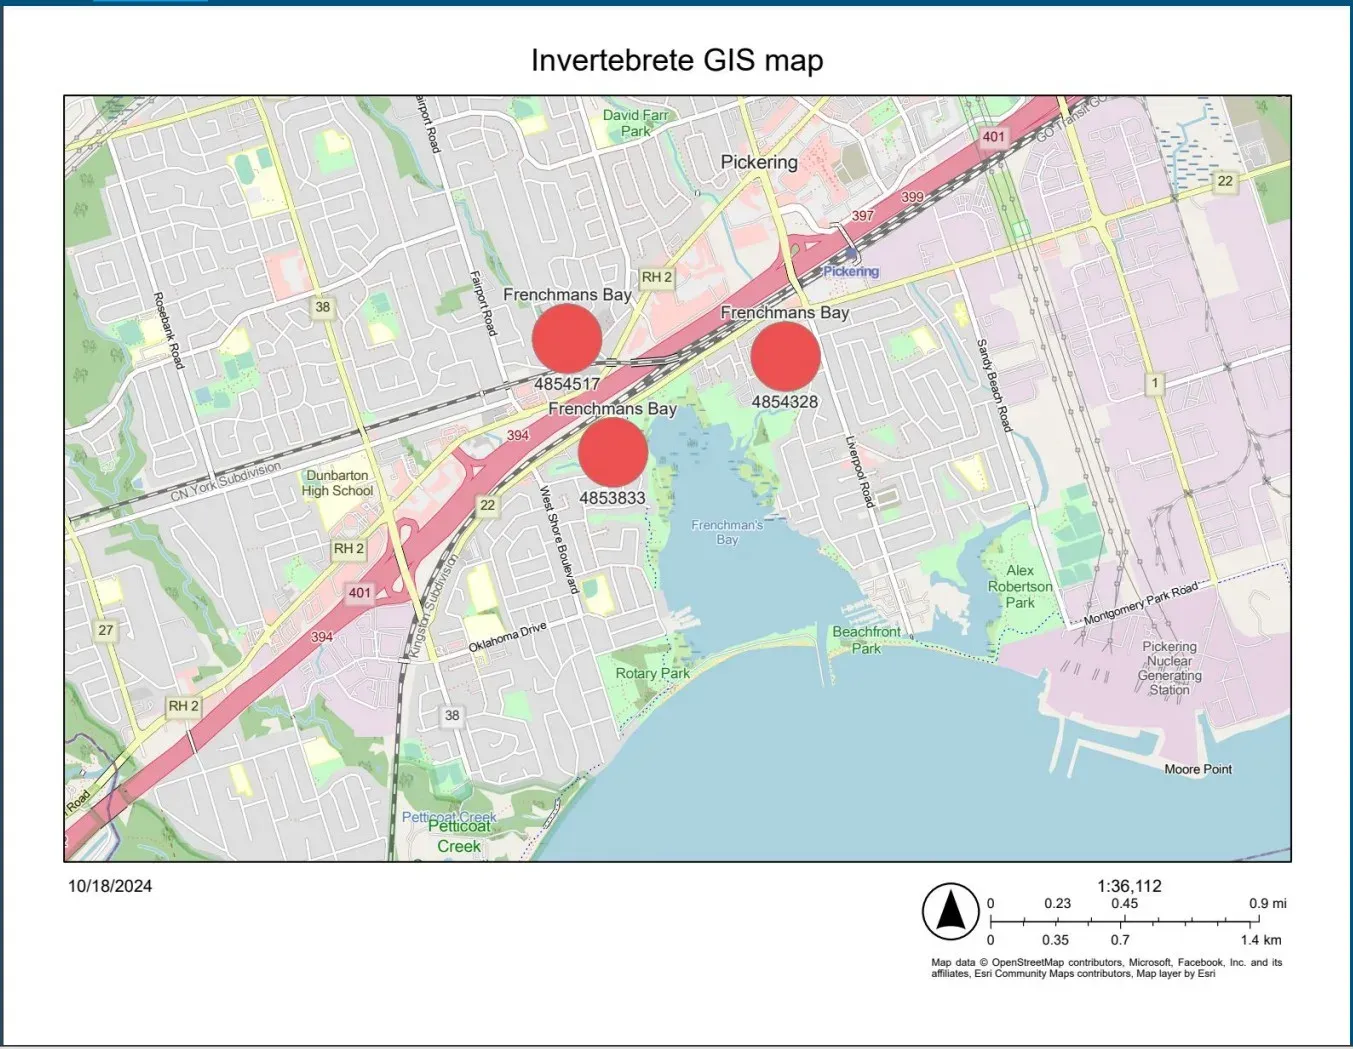
TRCA invertebrate records from a south-shore site (2015 to 2016) gave a short time series. Sodium was chosen as the water-quality parameter because road salt is the dominant urban contaminant here, and a t-test in R compared sodium concentrations between years. Sampling stations (4854517, 4853833, and 4854328) were georeferenced and mapped in GIS so the biology stayed tied to real locations.
Findings
The pooled Hilsenhoff Biotic Index came out at 5.73, which falls in the “fair” band. Trichoptera (caddisflies) were the most abundant order, and class taxa richness reached 15. Across the 2015-to-2016 TRCA record, abundance rose from 2,808 to 2,918 and Shannon-Wiener evenness climbed from 0.86 to 1.00 while richness held at 10. The sodium t-test returned p = 0.088, above the 0.05 threshold, so the year-over-year change wasn’t statistically significant, and reported sodium stayed under the 50 mg/L guideline.
Why it matters
For a watershed under heavy urban pressure, “fair” plus the presence of sensitive taxa points to limited pollution rather than collapse. The honest caveat is the small sample: with only two years of sodium data (df = 1), the t-test can’t rule out a real trend, and it shouldn’t. The clearest takeaway is methodological. Pairing biotic indices with water chemistry and GIS gives a fuller, more defensible read on watershed health than any one measure alone, and it flags exactly where longer monitoring is needed.