Measuring Solar Irradiance Over the Winter-Spring Transition
A six-week pyranometer study of seasonal solar input in Toronto
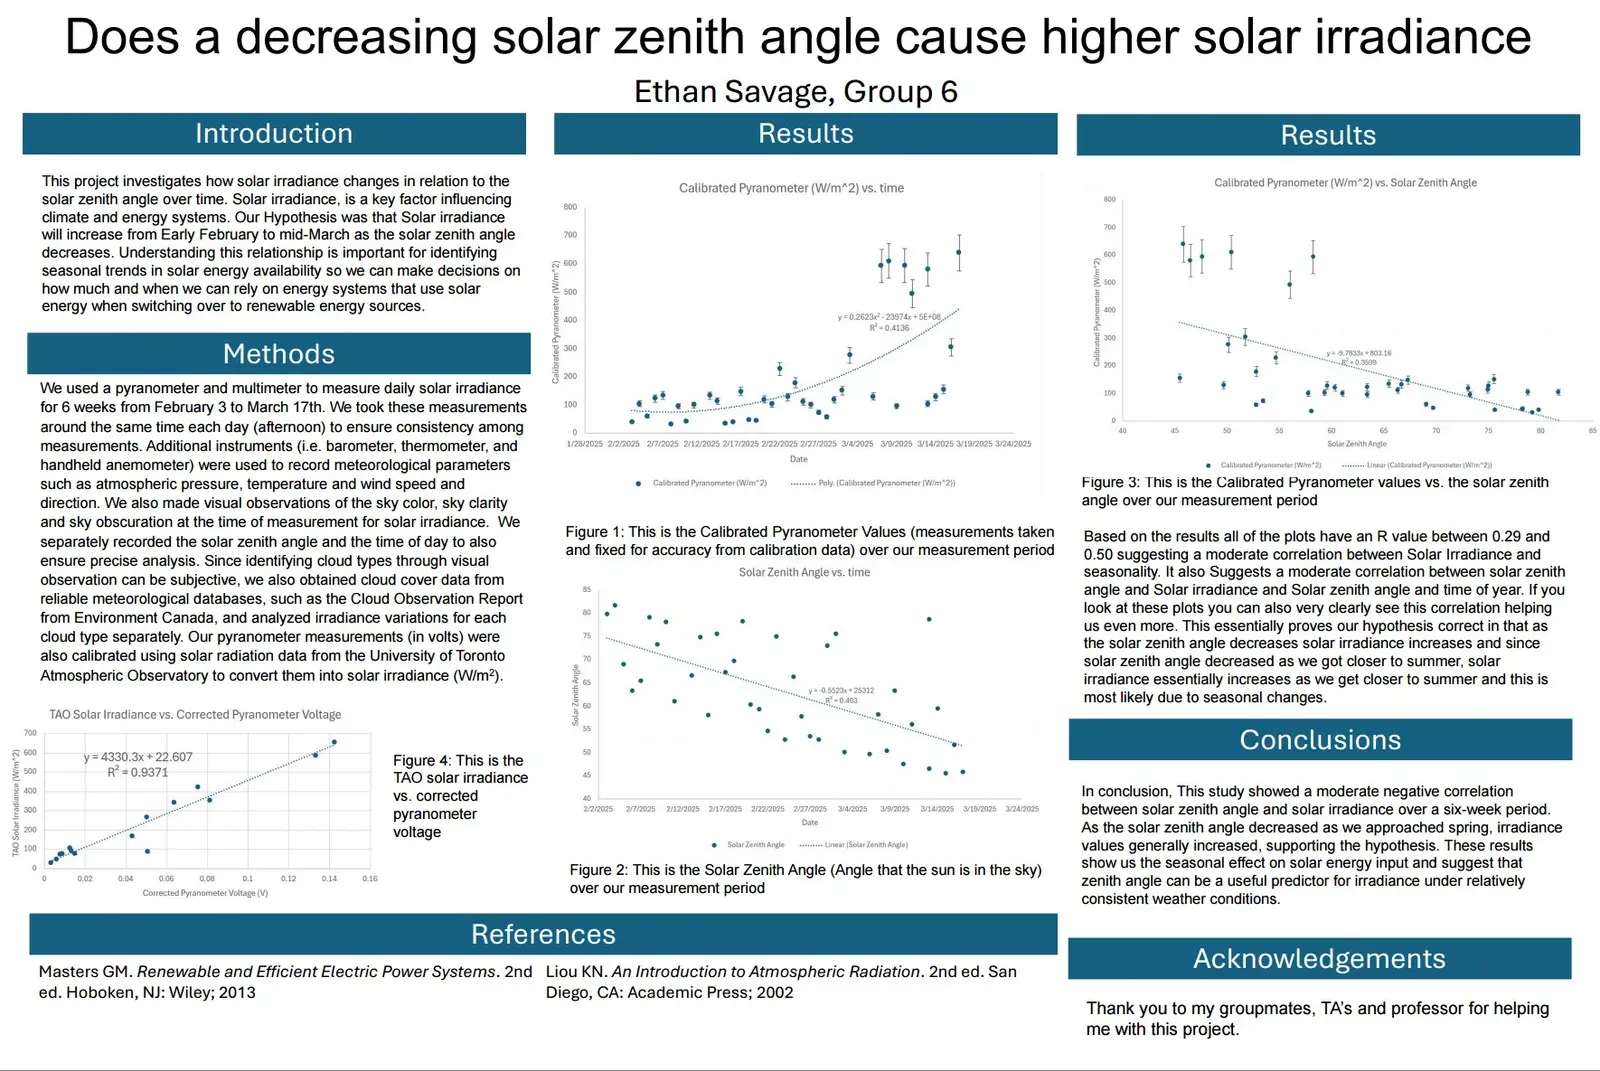
Over six weeks of daily measurements, calibrated solar irradiance rose from roughly 100 W/m² in early February to over 600 W/m² by mid-March, tracking a moderate negative correlation with solar zenith angle (R² = 0.36).
Result
Over six weeks of daily measurements, calibrated solar irradiance climbed from roughly 100 W/m² in early February to more than 600 W/m² by mid-March. That rise tracked a falling solar zenith angle, and the two showed a moderate negative correlation (R² = 0.36). As the sun climbed higher in the sky toward spring, more energy reached the ground.
Objective
The question was direct: does a smaller solar zenith angle drive higher solar irradiance over the winter-spring transition? Working in a group of four for an ENV237/238 physics project at the University of Toronto, we set time of year as the independent variable and irradiance (W/m²) as the dependent one. The null hypothesis was that irradiance wouldn’t change meaningfully from winter into spring.
Approach
Daily irradiance was measured from February 3 to March 17 using a pyranometer read with a multimeter, taken in the afternoon at consistent times to limit time-of-day effects. The raw output is a voltage, so each reading had to be converted to real units. We calibrated the pyranometer against solar radiation data from the University of Toronto Atmospheric Observatory, and the conversion held up well: a linear fit of observatory irradiance versus corrected voltage gave R² = 0.9371.
We didn’t measure light in isolation. A barometer, thermometer, and handheld anemometer logged pressure, temperature, and wind, and we recorded sky color, clarity, and obscuration at each reading. Because eyeballing cloud type is subjective, cloud cover came from Environment Canada’s Cloud Observation Report, and Toronto’s Air Quality Health Index helped account for aerosols. Solar zenith angle and time of day were logged separately for the analysis.
Findings
Three plots carried the result. Irradiance versus time rose across the window. Zenith angle versus time fell from about 75 to 50 degrees. Irradiance plotted directly against zenith angle gave a downward fit (R² = 0.36), confirming the negative relationship. The correlations are moderate, not tight, which is what you’d expect when day-to-day cloud and weather scatter the signal. Still, the pattern is consistent: under reasonably clear conditions, zenith angle is a useful predictor of how much solar energy is available, which matters for planning when solar systems can be relied on through the seasons.